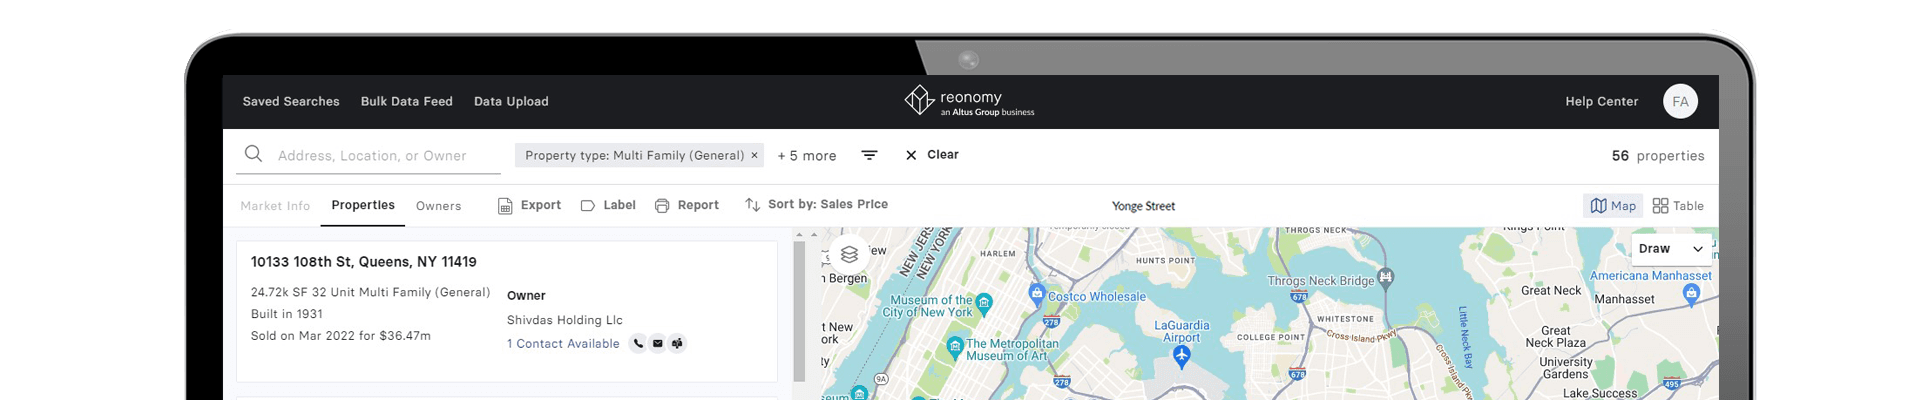
Mixed Use Properties in District Of Columbia
Unlock property data on all 132 mixed use properties in District of Columbia. Search across 1 counties to find the District of Columbia property records you need, and get in touch with Mixed Use Property owners in any market. Discover off-market properties likely to sell, refinance, or renovate, or find recent buyers and sellers.
Start a limited search below, or access full District of Columbia property data here.
1-30 of 132 results
-
1711 14th St NW, Washington, DC 20009
-
1711 14th St NW, Washington, DC 20009
-
300 D St SW, Washington, DC 20024
-
1328 Florida Ave NW, Washington, DC 20009
-
306 Florida Ave NW, Washington, DC 20001
-
5036 Queens Stroll Pl SE, Washington, DC 20019
-
1330 U St NW, Washington, DC 20009
-
4614 Minnesota Ave NE, Washington, DC 20019
-
4123 River Rd NW, Washington, DC 20016
-
709 D St NW, Washington, DC 20004
-
2029 P St NW, Washington, DC 20036
-
1361 Florida Ave NE, Washington, DC 20002
-
1012 Florida Ave NE, Washington, DC 20002
-
651 Florida Ave NW, Washington, DC 20001
-
3309 16th St NW, Washington, DC 20010
-
325 7th St SE, Washington, DC 20003
-
3114 Mount Pleasant St NW, Washington, DC 20010
-
1369 C St NE, Washington, DC 20002
-
909 19th St NE, Washington, DC 20002
-
2711 Connecticut Ave NW, Washington, DC 20008
-
623 H St NW, Washington, DC 20001
-
122 15th St NE, Washington, DC 20002
-
3409 Wisconsin Ave NW, Washington, DC 20016
-
900 New Hampshire Ave NW, Washington, DC 20037
-
5520 Connecticut Ave NW, Washington, DC 20015
-
4215 Connecticut Ave NW, Washington, DC 20008
-
1000 New Jersey Ave SE, Washington, DC 20003
-
3919 Clay Pl NE, Washington, DC 20019
-
804 Tuckerman St NW, Washington, DC 20011
-
3332 Martin Luther King Jr Ave SE, Washington, DC 20032
Popular searches around District of Columbia
Reonomy attracts a large community of District Of Columbia commercial real estate professionals, including brokers, investors, roofers, contractors, appraisers, insurance providers, and more—many of which specialize in mixed use properties.
To unlock full property records and owner contact information start a free trial
District Of Columbia mixed use property sold prices and values
Values and sold prices (last 24 months) | United States | District of Columbia |
---|---|---|
Average price/sqft | -- | -- |
Average sold price | $1,227,033 | $841,843 |
Median sold price | $146,772 | $875,000 |
Number of sales | 37,357 | 12 |
Number of sales over $250k | 14,738 | 11 |
Number of sales over $1m | 5,877 | 4 |
Number of sales over $10m | 1,009 | -- |
Average total tax amount | $13,392 | $187,729 |
Average assessed value | $599,435 | $22,310,629 |
Average market value | $855,740 | $22,310,629 |
District Of Columbia mixed use property property averages
Property averages | United States | District of Columbia |
---|---|---|
Average lot size | 139,899 sf | 18,176 sf |
Median lot size | 7,520 sf | 3,043 sf |
Average building area | -- | -- |
Median building area | -- | -- |
Median year built | 1940 | 1920 |
Average number of units | 13 | 24 |
Median number of units | 3 | 2 |
District Of Columbia mixed use property total supply
Supply | United States | District of Columbia |
---|---|---|
Number of parcels | 381,629 | 132 |
Aggregate lot acerage | 1,558,290 | 48 |
Aggregate building area | -- | -- |
Aggregate units | 1,908,883 | 2,511 |
District Of Columbia mixed use property industrial mortgages
Debt | United States | District of Columbia |
---|---|---|
Number of mortgages | 623,660 | 558 |
Average value of mortgages | $5,012,491 | $9,274,289 |
To unlock full property records and owner contact information start a free trial