Product update: Tax time series
We’re always looking for new, innovative ways to improve our platform for our users. To continue streamlining our search experience and enhancing our property information, we’re excited to announce the release of our new tax time series update.
Now, Reonomy users can perform targeted searches using tax information and explore three years’ of historical records on each and every property.
Why it matters
Our new tax time series was created by one of our engineers, Roger Beaman, who had first-hand experience being overtaxed but didn’t have the resources to confirm it. Realizing we had the power to solve this problem for other property owners, Roger led the charge in designing this feature to easily show owners whether or not they’re being overtaxed and help them file appeals.
Similarly, tax professionals, like consultants and accountants, can use the tool to prospect for properties that are currently being overtaxed and may want to file an appeal. As a whole, access to granular historical tax information, specifically percent increases and current rates, fuels a greater level of understanding of property taxation that can be harnessed to save owners money.
How it works
To search for properties via tax information, simply click the search bar in the Reonomy platform. This is indicated by the magnifying glass icon. Here, you’ll see we added a new tab labeled Tax. Click this to begin your search.
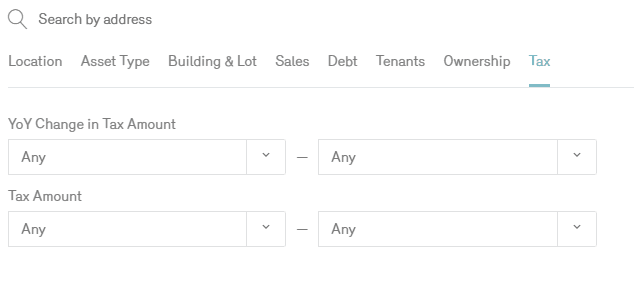
Once you’ve clicked the Tax tab, you’ll find two filters you can use to perform your search. The first is “YoY Change in Tax Amount”. Use the two corresponding drop-down options to select for the percent change you’d like to search by. You can either select Any, or choose from the following:
-20%
-10%
0
10%
20%
The second filter is “Tax Amount”. Use the two corresponding drop-down options to select the specific tax amounts you’d like to search by. You can either select Any, or choose from the following
$1,000
$3,000
$6,000
$10,000
$15,000
By choosing any combination of these filters, as well as any of the other Reonomy filters in the Location, Asset Type, Building & Lot, Sales and Ownership tabs, you’ll be served up a list of properties that meet your preferred criteria for further exploration.
For example, say you’re a consultant who focuses on tax appeals for multi-family buildings located in Dallas, Texas. You could search specifically for properties with taxes that have increased 10%-20% over the past year.
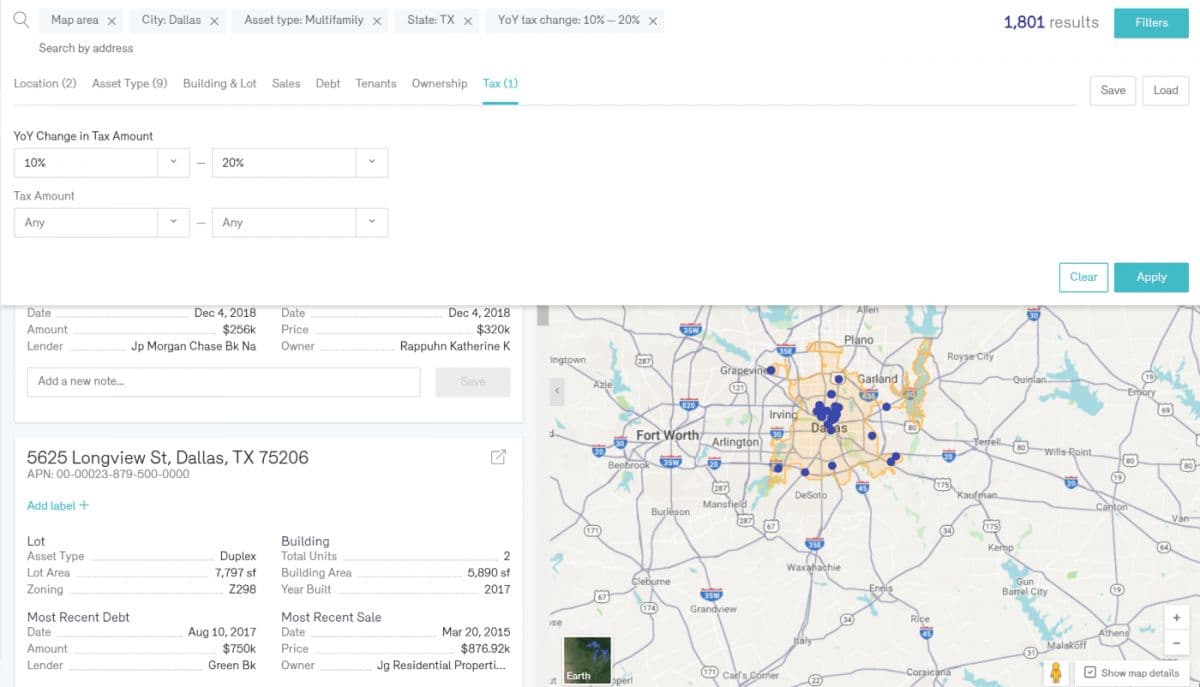
By applying these filters, the Reonomy map will automatically narrow down your search to populate with the properties that match these exact criteria.
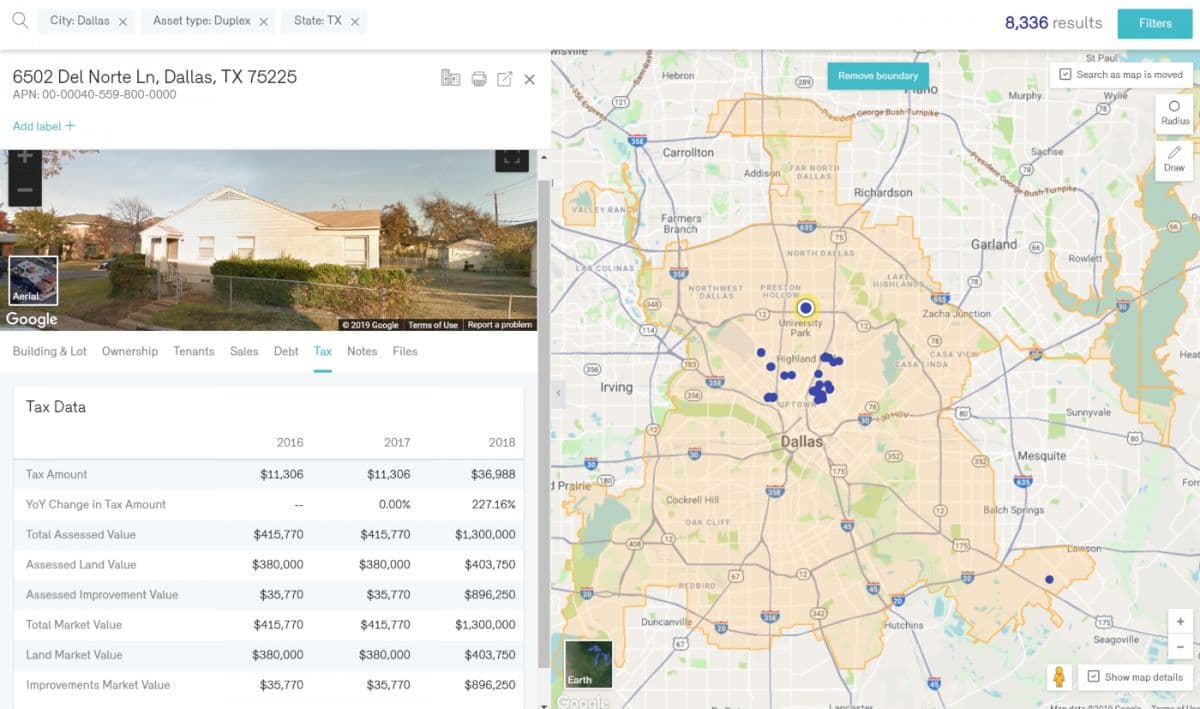
Our update also makes it easy to validate and explore tax information within each individual property page. When you click into specific properties on the Reonomy platform, you’ll find this information under the associated Tax tab. Here, you’ll find corresponding tax data from the last three years, including:
Tax Amount
YoY Change in Tax Amount
Total Assessed Value
Assessed Land Value
Assessed Improvement Value
Total Market Value
Land Market Value
Improvements Market Value
So, maybe you own a duplex in the Dallas metro and believe you’re being overtaxed. By searching for similar properties in the platform and exploring comparable tax records, you can gauge whether or not you should file an appeal.
Stay tuned for more updates as we continue to improve our platform to enhance your search experience.

Unlock CRE insights and data
Our Reonomy web app is powered by AI technology to help you access property owner information, property records, company data, and successfully close on commercial real estate deals.
Author

Reonomy
Resources team
Author
Reonomy
Resources team